0x.tools
X-Ray vision for Linux systems
By Tanel Poder
![]()
![]()
![]()
0x.tools (GitHub) is a set of open-source utilities for analyzing application performance on Linux. It has a goal of deployment simplicity and minimal dependencies, to reduce friction of systematic troubleshooting. No need to install kernel modules or heavy monitoring frameworks.
0x.tools allow you to measure individual thread level activity, like executed code, sleep states, system calls and wait locations - by tracking (not tracing) and then sampling the right events at the right time.
Conference & talk videos
- Tracking, Not Tracing, Linux Thread Activity for Complete System Visibility [10 min, eBPF Summit]
- Using eBPF Off-CPU Sampling to See What Your DBs are Really Waiting For [20 min, P99 CONF]
- eBPF & Cilium Office Hours: Livestream with Liz Rice [60 min, eCHO #158]
xCapture v3.0.0-alpha announced!
The first-ever public xCapture v3 release is now available! It uses libbpf with all the modern eBPF features!
Read my announcement blog entry here (until I update the info here):
The 0x.tools GitHub repository is here (go to the next directory there as the v3-alpha code is currently there).
- 0x.tools repository (go to
/next/subdirectory for v3-alpha)
OLD: xcapture-bpf overview talk at eBPF Summit 2024 (10 minutes)
A 10-minute intro video explaining the general concept and future plans
xcapture-bpf terminal highlighting and stacktiles in action
xcapture-bpf (and xtop) are like the Linux top tool, but extended with x-ray vision and ability to view your performance data from any chosen angle (that eBPF allows to instrument). This enables things like top for wall-clock time and much more. You can use it for system level overview and drill down into indivual threads’ activity and soon even into individual kernel events like lock waits or memory stalls. eBPF is not only customizable, it’s completely programmable and I plan to take full advantage of it. I have so far implemented less than 5% of everything this method and the new tool is capable of, stay tuned for more!
I included a screenshot image below, to show how the terminal text search/highlighting and scrolling capabilities work nicely together with my new stacktiles formatting method. This way you can fit more relevant things on your screen and not have to switch windows or scroll around that much, while keeping some structure and sanity in place with all the stack traces.
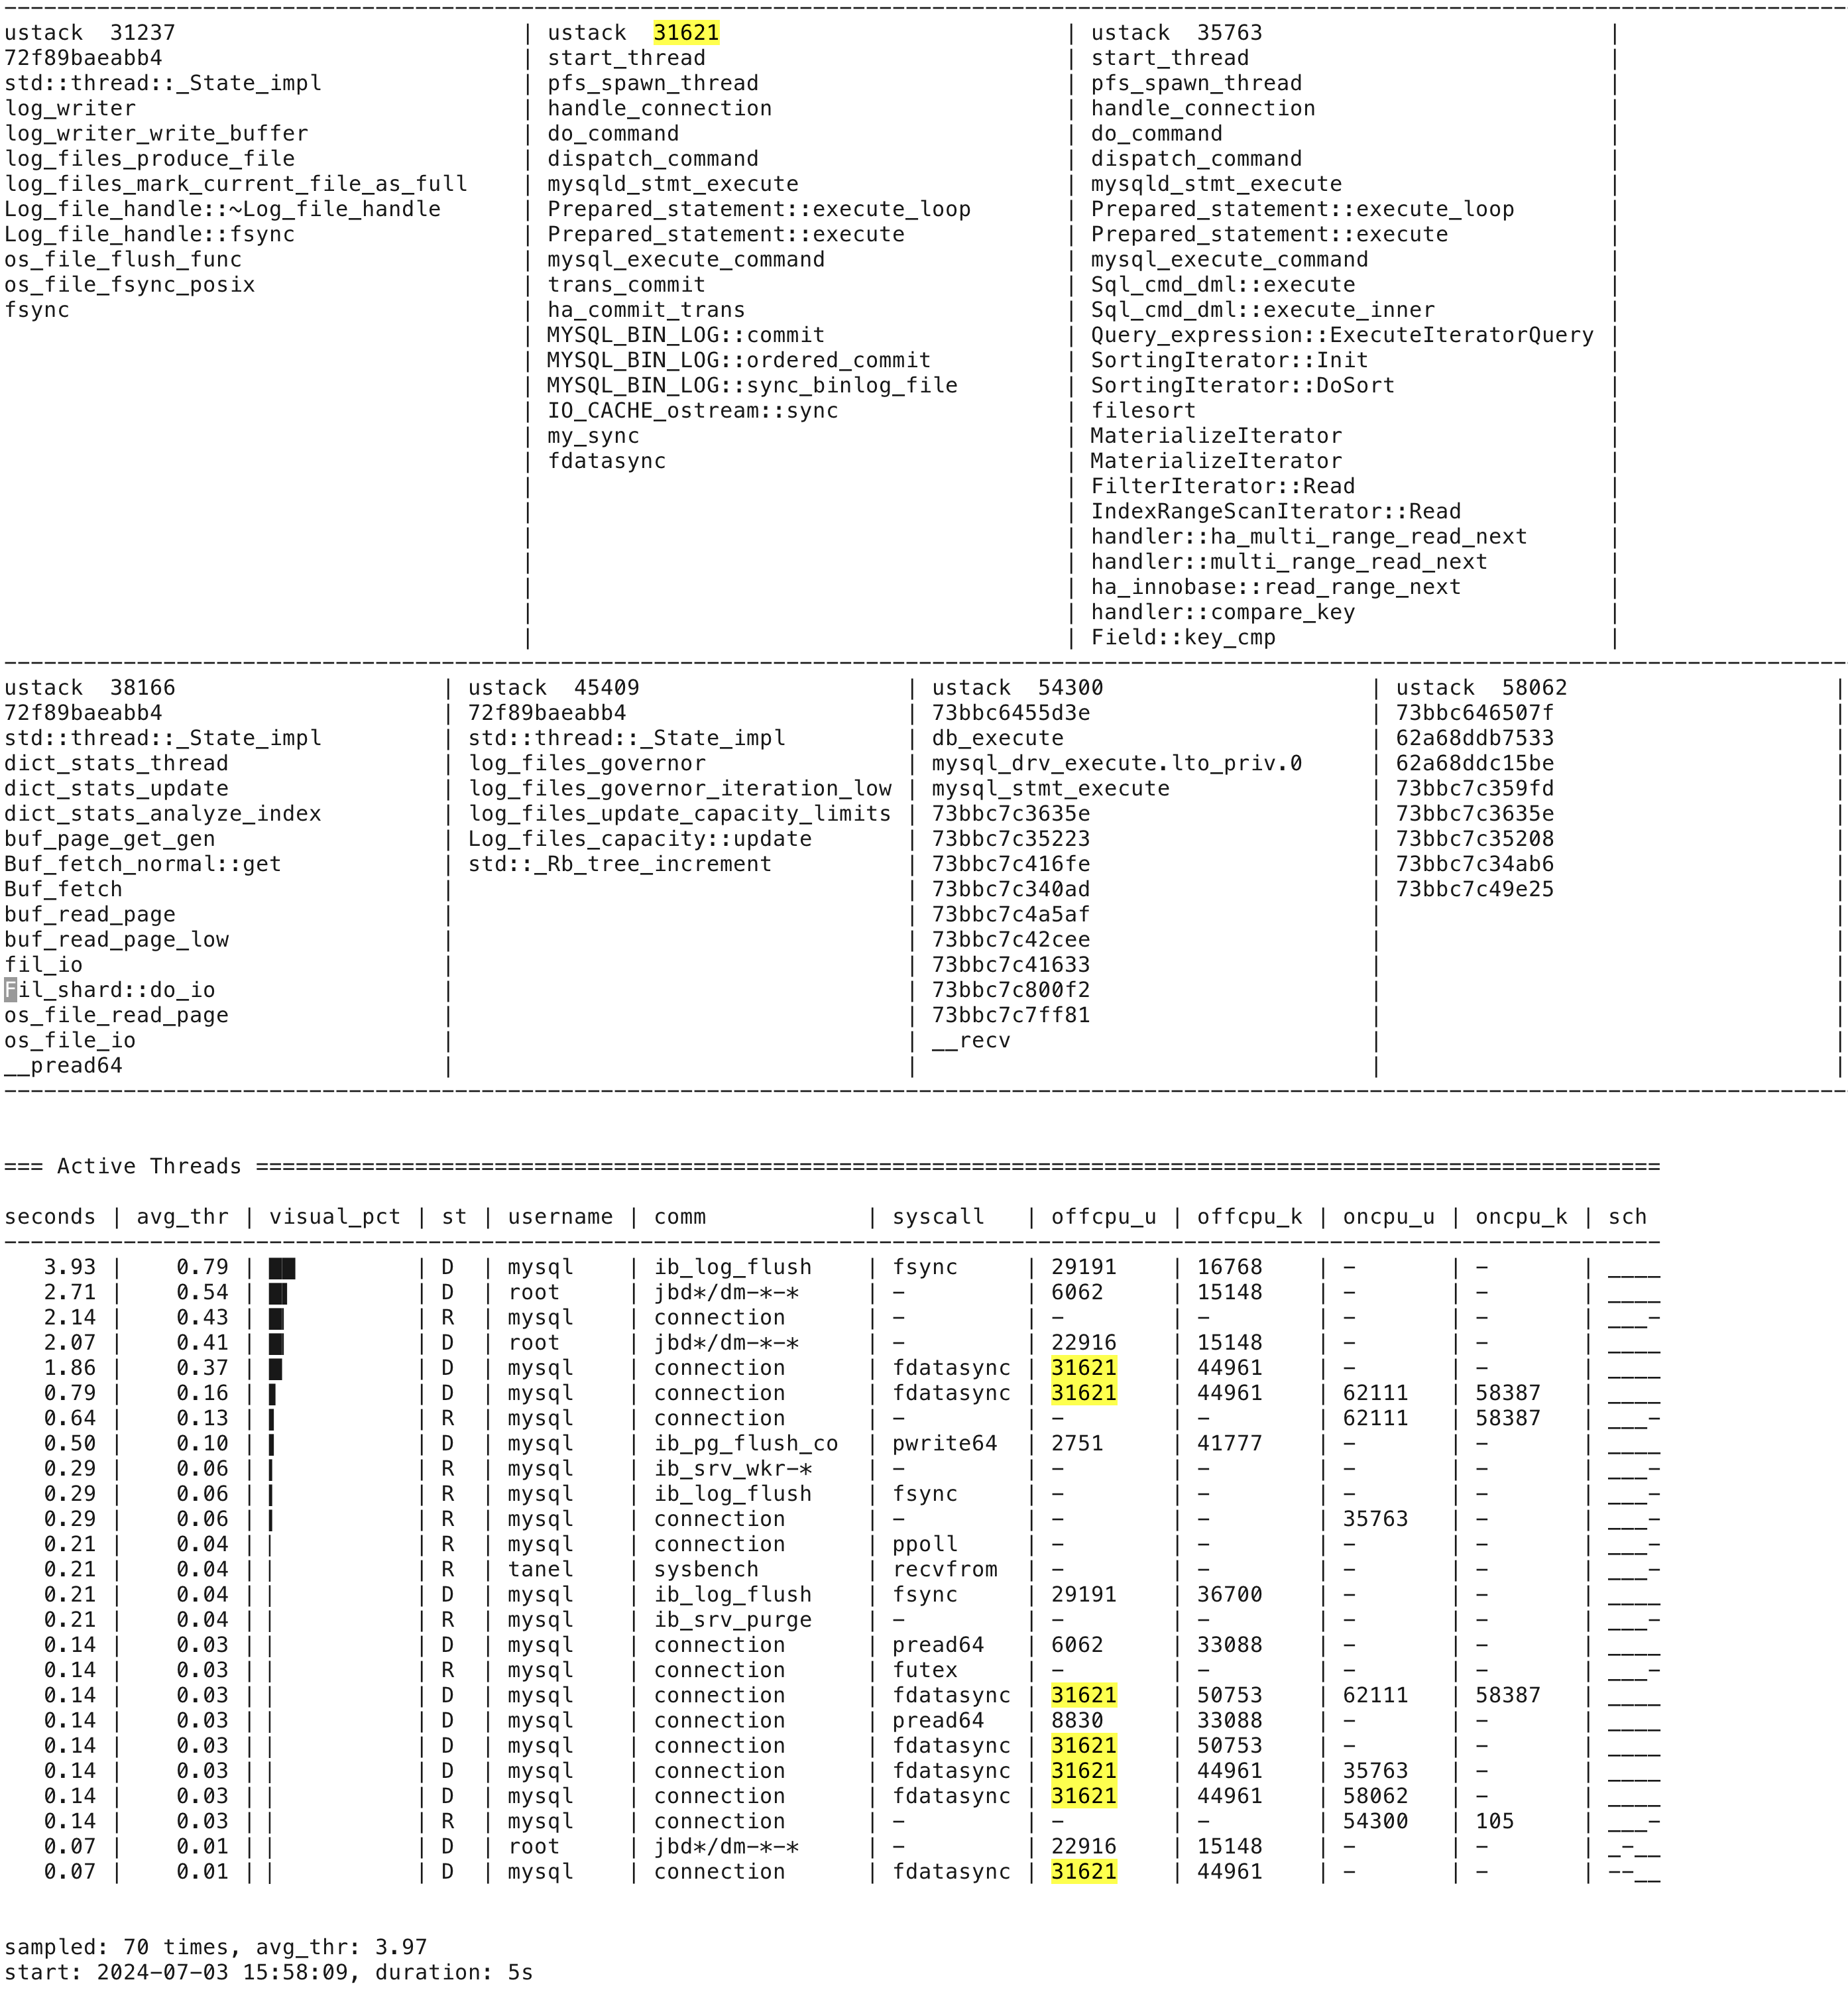
The stacktiles do not have to contain only stacks of function names, but could contain other things, like filenames or any other thing, like top memory allocation reasons (and amounts) done under a code location reported below, etc.
xcapture-bpf installation
xcapture-bpf is still in beta, don’t run it on busy production systems yet. As it uses eBPF (and currently BCC with python3 as a reporting frontend), you’d need to be at least on RHEL 8.1 (or a clone) or Ubuntu 24.04. Ubuntu 22.04’s BCC has some kernel header compatibility issue (can be worked around by building BCC from source 1) and the 20.04 kernel does not have the required eBPF features available. These are the only versions I’ve tested with so far, on x86_64 and arm64 platforms. If you try it out on any other distros/platforms/versions, please tell me the results!
On RHEL8, you can install the prerequisites with this:
$ sudo dnf install bcc bcc-tools python3 python3-bcc
$ git clone https://github.com/tanelpoder/0xtools.git

$ ls -l 0xtools/bin/xcapture-bpf*
-rwxrwxr-x. 1 tanel tanel 25724 Jul  2 22:04 0xtools/bin/xcapture-bpf
-rw-rw-r--. 1 tanel tanel 12127 Jul  2 15:34 0xtools/bin/xcapture-bpf.c

$ cat 0xtools/bin/xtop
#!/usr/bin/bash

CURDIR="$(dirname "$(realpath "$0")")"

${CURDIR}/xcapture-bpf --xtop --clear-screen $*

$ cd 0xtools/bin
$ sudo ./xtop
If you don’t want to clone/download the whole 0xtools repository, then for xcapture-bpf, you only need the 2 xcapture-bpf* files listed above. No need to compile the .c file as the BCC toolset takes care of it on the fly. xtop is just a simple shell wrapper for convenience (and now there’s an “xtop” in the Linux command line namespace! ;-)
bcc-tools are not really needed for xcapture-bpf itself, but they’re worth checking out, if you’re gonna play with eBPF tools anyway.
The details about the rest of the 0xtools are below (all the other tools just read various /proc files, no eBPF needed for them).
Table of Contents
Included Tools
You get two classes of utilities:
- Real-time interactive tools for analyzing current system behavior as it is happening.
- Low-overhead thread activity samplers for always-on low-frequency profiling of production systems. The continuously captured data allows you to “go back in time” and systematically troubleshoot even intermittent problems right after (or during) their first occurrence.
| Command | Description |
|---|---|
| xcapture (v3) | Linux Performance Analysis with Modern eBPF and DuckDB (beta) |
| lsds | List All Linux Block Devices and Settings in One Place |
| psn | Show current top thread activity by sampling /proc files (Python) |
| syscallargs | List all system calls with their arguments |
| tracepointargs | List Any Linux Tracepoint with Their Arguments, Datatypes and Related Structs |
| schedlat | Show single process’es CPU scheduling latency as a % of its runtime |
| xcapture (v1) | Low-overhead thread state sampler and archiver reading /proc files (see below) |
| xcapture-bpf (v2) | Low-overhead programmable thread state sampler build with eBPF (old prototype) |
| run_xcapture.sh | A simple “daemon” script for keeping xcapture running |
| run_xcpu.sh | Low-frequency continuous stack sampling for threads on CPU (using perf) |
Usage & Example Output
Sample Linux thread activity and show fixed-width output on screen:
$ xcapture

0xTools xcapture v1.0 by Tanel Poder [https://0x.tools]

Sampling /proc...

DATE       TIME             PID     TID USERNAME        ST COMMAND                   SYSCALL                   WCHAN
2020-10-17 12:01:50.583    6404    7524 mysql           R  (mysqld)                  fsync                     wait_on_page_bit
2020-10-17 12:01:50.583    6404    8944 mysql           D  (mysqld)                  fsync                     wait_on_page_bit
2020-10-17 12:01:50.583    6404    8946 mysql           D  (mysqld)                  fsync                     wait_on_page_bit
2020-10-17 12:01:50.583    6404   76046 mysql           D  (mysqld)                  fsync                     wait_on_page_bit
2020-10-17 12:01:50.583    6404   76811 mysql           D  (mysqld)                  fdatasync                 xfs_log_force_lsn
2020-10-17 12:01:50.583    6404   76815 mysql           D  (mysqld)                  fsync                     blkdev_issue_flush
2020-10-17 12:01:50.583    8803    8803 root            R  (md10_resync)             [running]                 0

DATE       TIME             PID     TID USERNAME        ST COMMAND                   SYSCALL                   WCHAN
2020-10-17 12:01:51.623    6404    7521 mysql           D  (mysqld)                  pwrite64                  xfs_file_buffered_aio_write
2020-10-17 12:01:51.623    6404    7524 mysql           D  (mysqld)                  fsync                     xfs_log_force_lsn
2020-10-17 12:01:51.623    6404    7767 mysql           D  (mysqld)                  fsync                     xfs_log_force_lsn
2020-10-17 12:01:51.623    6404    8398 mysql           D  (mysqld)                  fsync                     call_rwsem_down_read_failed
2020-10-17 12:01:51.623    6404    5446 mysql           D  (mysqld)                  fsync                     xfs_log_force_lsn
2020-10-17 12:01:51.623    6404    8941 mysql           D  (mysqld)                  pwrite64                  xfs_file_buffered_aio_write
2020-10-17 12:01:51.623    6404    8944 mysql           D  (mysqld)                  pwrite64                  xfs_file_buffered_aio_write
2020-10-17 12:01:51.623    6404    8945 mysql           D  (mysqld)                  pwrite64                  xfs_file_buffered_aio_write
2020-10-17 12:01:51.623    6404   76045 mysql           D  (mysqld)                  fsync                     call_rwsem_down_read_failed
2020-10-17 12:01:51.623    6404   76046 mysql           D  (mysqld)                  pwrite64                  xfs_file_buffered_aio_write
2020-10-17 12:01:51.623    6404   76810 mysql           D  (mysqld)                  pwrite64                  xfs_file_buffered_aio_write
2020-10-17 12:01:51.623    6404   76811 mysql           D  (mysqld)                  fdatasync                 xfs_log_force_lsn
2020-10-17 12:01:51.623    6404   76812 mysql           D  (mysqld)                  fsync                     wait_on_page_bit
2020-10-17 12:01:51.623    8803    8803 root            D  (md10_resync)             [no_syscall]              msleep
Watch a SVG video of xcapture in action!

Sample threads in all states (including Sleeping) and write output into hourly CSV files:
$ xcapture -a -o /data/xcap &

$ head 2020-10-16.21.csv
TS,PID,TID,USERNAME,ST,COMMAND,SYSCALL,WCHAN,EXE,CMDLINE,KSTACK
2020-10-16 21:00:00.001,5335,5335,root,R,(collectl),[running],0,perl,/usr/bin/perl,
2020-10-16 21:00:00.001,8803,8803,root,D,(md10_resync),[no_syscall],msleep,-,-,->ret_from_fork_nospec_begin()->kthread()->md_thread()->md_do_sync()->msleep()
2020-10-16 21:00:01.038,8803,8803,root,R,(md10_resync),[no_syscall],md_do_sync,-,-,->ret_from_fork_nospec_begin()->kthread()->md_thread()->md_do_sync()
2020-10-16 21:00:02.075,8803,8803,root,D,(md10_resync),[no_syscall],md_do_sync,-,-,->ret_from_fork_nospec_begin()->kthread()->md_thread()->md_do_sync()
2020-10-16 21:00:02.075,16762,16762,oracle,R,(ora_m000_lin19c),[running],0,oracle,ora_m000_LIN19C,->do_blockdev_direct_IO()->dio_complete()
2020-10-16 21:00:03.112,8803,8803,root,R,(md10_resync),[no_syscall],md_do_sync,-,-,->ret_from_fork_nospec_begin()->kthread()->md_thread()->md_do_sync()
2020-10-16 21:00:04.149,8803,8803,root,D,(md10_resync),[no_syscall],msleep,-,-,->ret_from_fork_nospec_begin()->kthread()->md_thread()->md_do_sync()->msleep()
2020-10-16 21:00:05.186,8803,8803,root,D,(md10_resync),[no_syscall],md_do_sync,-,-,->ret_from_fork_nospec_begin()->kthread()->md_thread()->md_do_sync()
2020-10-16 21:00:05.186,65913,65913,oracle,D,(ora_ckpt_lin122),pwrite64,blkdev_issue_flush,oracle,ora_ckpt_LIN122,->system_call_fastpath()->SyS_pwrite64()->vfs_write()->do_sync_write()->xfs_file_aio_write()->generic_write_sync()->xfs_file_fsync()->xfs_blkdev_issue_flush()->blkdev_issue_flush()
You can “Query” the thread activity history for performance analysis on the command line (or just load the CSV into any database):
Query CSV files with standard Linux text processing tools. It’s like SQL but with different keywords: grep for filtering, cut, awk for column projection, uniq for group by and sort for ordering. Filename patterns like cat 2020-10-??.0[89].csv could be used for scanning through only the files of interest (partition pruning):
$ cat 2020-10-13.01.csv | awk -F, '{ printf("%2s %-20s %-20s %s\n",$5,$4,$7,$10) }' | sort | uniq -c | sort -nbr | head -20
   2303  D root                 read                 -
   1761  R tanel                [running]            stress
   1384  D postgres             pread64              postgres: tanel pgbench [local] UPDATE
    894  R root                 [running]            -
    229  R root                 read                 -
    229  D mysql                fsync                /usr/sbin/mysqld
    144  R tanel                [running]            -
    115  - -                    -                    -
    110  D oracle               io_submit            ora_ckpt_LINPRD
    101  D root                 [running]            -
     73  D root                 read                 dd
     58  R root                 [running]            /opt/oracle.ahf/jre/bin/java
     55  R mysql                [running]            /usr/sbin/mysqld
     52  D tanel                [no_syscall]         stress
     51  R oracle               [running]            oracleLIN19C
     50  R root                 [running]            dd
     35  R oracle               [running]            xe_mz01_XE
     32  R tanel                [running]            /usr/lib/jvm/java-1.8.0-openjdk-1.8.0.262.b10-0.el7_8.x86_64/jre/bin/java
     29  R oracle               [running]            pidstat
     27  D oracle               pread64              oracleLIN19C
Installation & Usage
xcapture (v1), schedlat and psn sample the Linux /proc filesystem just like standard tools like ps, top and lsof do. The /proc filesystem is essentially Linux kernel presenting useful metrics into userspace as user-readable files. So, you do not need any additional Linux configuration or anything fancy to be installed on your hosts. 0x.tools require Linux kernel version 2.6 or later, so they will work even on your legacy installations (like RHEL 5, CentOS 5) from 15 years ago.
For running psn on CentOS 5 (RHEL 5 clones), you need to have Python 2.6+ on it (it can be installed from EPEL repo).
$ git clone https://github.com/tanelpoder/0xtools
$ make
$ sudo make install
If you want to put additional utilities like schedlat and syscallargs into /usr/bin, then also run:
$ sudo make install_utils
xcapture-bpf (v2) uses the Linux bcc toolset and Python3 as a reporting frontend. No installation is currently needed, as you can just run the xcapture-bpf Python script in whatever directory it is and it automatically compiles & loads the xcapture-bpf.c BPF file on the fly.
Running 0xTools utilities:
xCapture
$ xcapture

0x.Tools xcapture v1.0 by Tanel Poder [https://0x.tools]

Usage:
  xcapture [options]

  By default, sample all /proc tasks in states R, D every second and print to stdout

  Options:
    -a             capture tasks in additional states, even the ones Sleeping (S)
    -A             capture tasks in All states, including Zombie (Z), Exiting (X), Idle (I)
    -c <c1,c2>     print additional columns (for example: -c exe,cmdline,kstack)
    -d <N>         seconds to sleep between samples (default: 1)
    -E <string>    custom task state Exclusion filter (default: XZIS)
    -h             display this help message
    -o <dirname>   write wide output into hourly CSV files in this directory instead of stdout


$ xcapture -c exe,kstack
$ xcapture -o .
$ xcapture -o /data/perf_archive/xcap
Linux Process Snapper
Linux Process Snapper is a Python script meant for troubleshooting currently on-going issues (no historical capture). It currently reports more fields directly from /proc than xcapture captures (like filenames accessed by IO system calls). I plan to improve this tool so that it could use xcapture CSV files as an input, in addition to current real-time monitoring.
IO bottleneck example: My “pipeline” is bottlenecked by writes to the output file, not input reads:
$ psn -p 18286 -G syscall,filename

Linux Process Snapper v0.14 by Tanel Poder [https://0x.tools]
Sampling /proc/stat, syscall for 5 seconds... finished.


=== Active Threads ==================================================================================

 samples | avg_threads | comm | state                  | syscall   | filename
-----------------------------------------------------------------------------------------------------
      79 |        0.79 | (dd) | Disk (Uninterruptible) | write     | /backup/tanel/test (stdout)
       7 |        0.07 | (dd) | Disk (Uninterruptible) | [running] |
       5 |        0.05 | (dd) | Running (ON CPU)       | write     | /backup/tanel/test (stdout)
       4 |        0.04 | (dd) | Disk (Uninterruptible) | read      | /reco/fio/mmapfile.0.0 (stdin)
       3 |        0.03 | (dd) | Running (ON CPU)       | [running] |
       2 |        0.02 | (dd) | Running (ON CPU)       | read      | /reco/fio/mmapfile.0.0 (stdin)  ```
MySQL I/O bottleneck example: there’s some OS kernel inode level semaphore contention due to frequent use of fsync():
$ sudo psn -p "mysqld|kwork" -G syscall,wchan

Linux Process Snapper v0.14 by Tanel Poder [https://0x.tools]
Sampling /proc/syscall, stat, wchan for 5 seconds... finished.


=== Active Threads ========================================================================================

 samples | avg_threads | comm          | state                  | syscall   | wchan
-----------------------------------------------------------------------------------------------------------
      25 |        3.12 | (mysqld)      | Disk (Uninterruptible) | fsync     | _xfs_log_force_lsn
      16 |        2.00 | (mysqld)      | Running (ON CPU)       | [running] | 0
      14 |        1.75 | (mysqld)      | Disk (Uninterruptible) | pwrite64  | call_rwsem_down_write_failed
       8 |        1.00 | (mysqld)      | Disk (Uninterruptible) | fsync     | submit_bio_wait
       4 |        0.50 | (mysqld)      | Disk (Uninterruptible) | pread64   | io_schedule
       4 |        0.50 | (mysqld)      | Disk (Uninterruptible) | pwrite64  | io_schedule
       3 |        0.38 | (mysqld)      | Disk (Uninterruptible) | pread64   | 0
       3 |        0.38 | (mysqld)      | Running (ON CPU)       | [running] | io_schedule
       3 |        0.38 | (mysqld)      | Running (ON CPU)       | pread64   | 0
       2 |        0.25 | (mysqld)      | Disk (Uninterruptible) | [running] | 0
       1 |        0.12 | (kworker/*:*) | Running (ON CPU)       | read      | worker_thread
       1 |        0.12 | (mysqld)      | Disk (Uninterruptible) | fsync     | io_schedule
       1 |        0.12 | (mysqld)      | Disk (Uninterruptible) | futex     | call_rwsem_down_write_failed
       1 |        0.12 | (mysqld)      | Disk (Uninterruptible) | poll      | 0
       1 |        0.12 | (mysqld)      | Disk (Uninterruptible) | pwrite64  | _xfs_log_force_lsn
       1 |        0.12 | (mysqld)      | Running (ON CPU)       | fsync     | submit_bio_wait
       1 |        0.12 | (mysqld)      | Running (ON CPU)       | futex     | futex_wait_queue_me
More info and examples are available at Tanel Poder’s Linux Performance Troubleshooting Page
SchedLat
$ ./schedlat.py 29801
SchedLat by Tanel Poder [https://0x.tools]

PID=29801 COMM=oracle_29801_li

TIMESTAMP              %CPU   %LAT   %SLP
2020-02-26 23:17:35   100.0    0.0    0.0   <<-- no CPU shortage, process 100% on CPU
2020-02-26 23:17:36   100.0    0.0    0.0
2020-02-26 23:17:37   100.0    0.0    0.0
2020-02-26 23:17:38   100.0    0.0    0.0   <<-- %SLP = 100-(%CPU+%LAT). When Linux reports slightly
2020-02-26 23:17:39    98.0    0.0    2.0        more than "100%" of CPU+LAT, then the derived
2020-02-26 23:17:40     0.0    0.0  100.0        "remaining time" SLP% may show a negative value
2020-02-26 23:17:41     0.0    0.0  100.0
2020-02-26 23:17:42     0.0    0.0  100.0   <<-- no CPU shortage, process sleeping
2020-02-26 23:17:43     0.4    0.0   99.6
2020-02-26 23:17:44    33.5    0.2   66.3   <<-- no CPU shortage, process doing synchronous I/Os
2020-02-26 23:17:45    55.5    0.2   44.2        in a loop (thus taken off CPU frequently by scheduler)
2020-02-26 23:17:46    53.9    0.2   45.9
2020-02-26 23:17:47    54.5    0.2   45.3
2020-02-26 23:17:48    59.1    0.2   40.7
2020-02-26 23:17:49     4.4    0.0   95.6
2020-02-26 23:17:50    58.5    0.1   41.4
2020-02-26 23:17:51    95.7    0.0    4.3
2020-02-26 23:17:52     0.3    0.0   99.7
2020-02-26 23:17:53     0.1    0.0   99.9
2020-02-26 23:17:54     0.1    0.0   99.9
2020-02-26 23:17:55     0.3    1.1   98.6
2020-02-26 23:17:56     0.1    6.0   93.9
2020-02-26 23:17:57     0.1   15.0   84.9
2020-02-26 23:17:58     0.1   13.8   86.1
2020-02-26 23:17:59     9.6   61.4   29.0   <<-- CPU shortage + process doing synchronous I/Os in a loop
2020-02-26 23:18:00    14.6   83.9    1.5   <<-- and spending more time in CPU runqueue after every I/O
2020-02-26 23:18:01    31.4   59.7    8.9
2020-02-26 23:18:02    13.0   13.9   73.1
2020-02-26 23:18:03     0.3    5.3   94.4
There are more details in my Measuring Linux CPU Scheduling Latency blog entry.
CPU profiling
When you look into the run_xcpu.sh, you’ll see that I’m currently using just perf under the hood with 1 Hz frequency. You can have it always-on with no noticeable performance overhead!
$ cat bin/run_xcpu.sh
...
perf record -g -F 1 -a \
            --switch-output=1m \
            --timestamp-filename \
            --timestamp \
            -o $1/xcpu

...
With the above arguments, perf writes the sampled on-CPU stack traces into 1-minute granularity files.
Then all you need to do is run perf on the file with the right timestamp, to zoom in to the time of your performance problem:
$ perf report -s sym,dso -i xcpu.2020101619323791
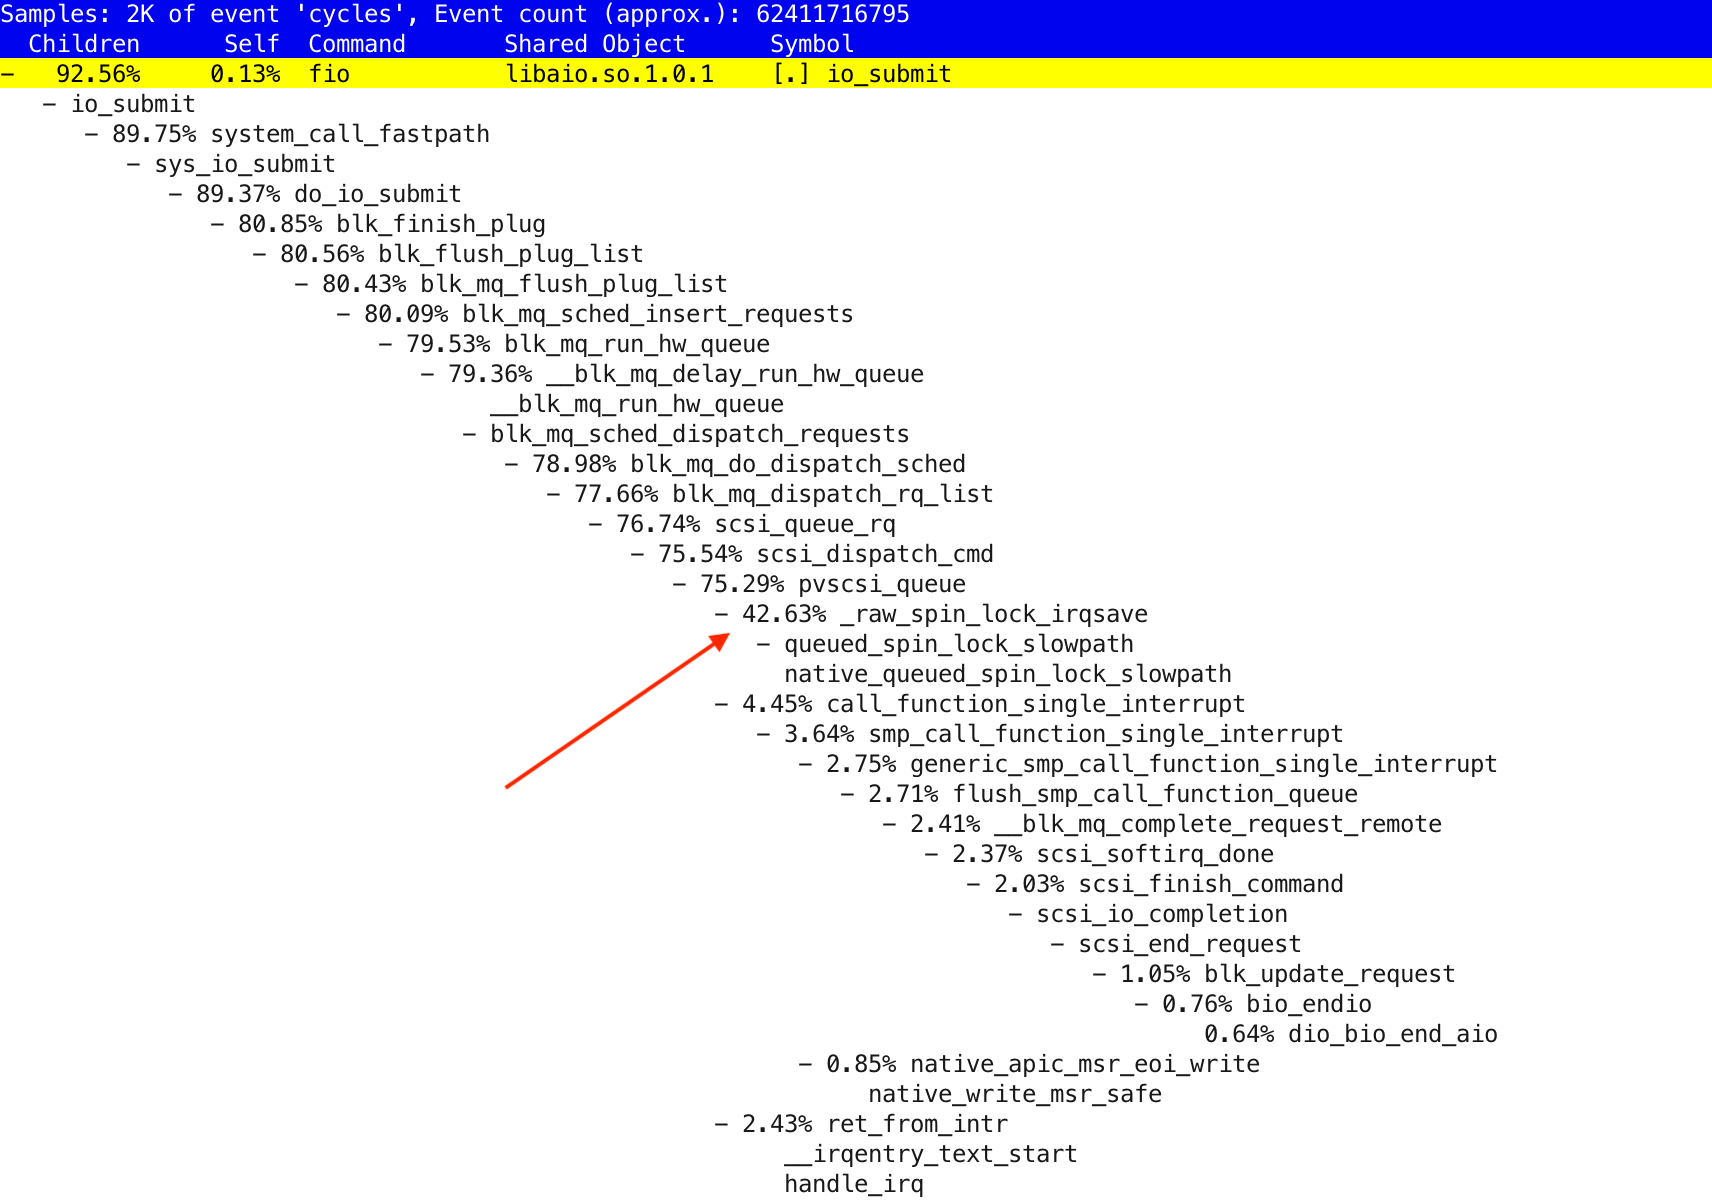 Perf CPU usage profile, including kernel-mode and interrupts CPU usage
FAQ
How is 0x.tools licensed?
0x.tools is an open source, GPL-licensed toolset, so you can use it like most other standard command line tools in your Linux distribution.
What is the measurement overhead?
0x.tools xcapture is designed to have very low overhead, well under 1% of your server’s CPU capacity, even when sampling every second. Note that xcapture does not invoke any tracing, but samples already built-in kernel instrumentation from /proc file system asynchronously and independently. Therefore it won’t slow any of your existing applications down, but uses a small percentage of one CPU in the system for its sampling. In extreme cases (with tens of thousands of active threads), you can reduce sampling frequency to reduce xcapture CPU usage.
The run_xcpu.sh CPU sampling script uses standard Linux perf utility under the hood, with just 1 Hz sampling rate by default. Thanks to the low-frequency sampling, perf will not cause noticeable overhead for your applications.
Is it safe to use in production?
0x.tools are designed to be safely used in production, including traditional enterprise environments where you can’t just upgrade to latest OS version at will or load custom kernel modules. All the code is open source, without any dependencies outside the standard Linux utilities and libraries, skimming through a few hundred lines of 0x.tools C and Python code should be doable in matter of minutes.
As with all software and tools, I recommend to try them first on a test system (ideally similar to production) and see how it works, before deploying to production.
Why not just use perf for everything (including xcapture)?
Perf sampling captures only on-CPU activity by default. If you have 32 CPUs, it will check what code is running on them at every sample, but does not aim to walk through the hundreds (or thousands) of OS threads that happen to be sleeping. While it is possible to enable tracing for off-cpu events in Perf, it comes with a high tracing overhead (and later, overhead of post-processing these high-frequency events).
Why not just use BPF instead of /proc sampling?
(This answer was written back in 2019, things have changed since then, if you are using a more modern Linux version)
In short, eBPF is not available for wide-scale production use in traditional enterprises (think banks, telcos and other Fortune 500s with decades of IT history). This may come as a surprise if you’ve worked only for startups running latest ephemeral Ubuntu containers in the cloud :-) For example RedHat started actually supporting eBPF in RHEL 8.1 (Released Nov 2019). The enterprises I work with, still have RHEL6 (kernel 2.6.32) as their mostly widely used OS version, with RHEL7 (and CentOS 7) gaining traction. So “let’s just do a major OS upgrade” for troubleshooting this performance spike is out of the question.
Nevertheless, I have written an eBPF sampler prototype already, it combines both thread state and CPU usage profiling into one tool. But I wanted to productionize the simpler, widely available /proc file-based profiler first, for practical reasons.
Why not just use distributed tracing like OpenTracing, Zipkin, Jaeger?
These powerful, but complex frameworks are high level end-to-end tracers of request flow through application layers and components. They are designed to point out in which component of your distributed multi-tier system most of the user response was spent, but they do not drill down into the reason why. 0x.tools are designed to fill that gap.
Why not just use something like Prometheus?
Prometheus is designed for shipping, storing and serving system & appliction time-series metrics captured from a large fleet of servers & applications. You can plot nice dashboards with charts showing various latency, request count and system utilization metrics over time. Such time-series metrics are useful background info, but do not allow you to drill down into the low level reasons of increased system activity, application resource usage or misbehavior of the OS kernel itself.
What’s next?
There are a lot of new features and utilities that can be added to 0xTools suite. Before I go there, I will work on some packaging & productionization things first (scripts for automatic compression & archiving of the captured files, installation via a RPM/DEB package, built-in data visualization). Feel free to submit ideas and issues in the 0x.Tools GitHub repo.
-
I also deliver consulting and training around systematic Linux troubleshooting & tuning, including helping you to come up with a strategy for rolling out always-on profiling for production systems in your company.
-
Get 0x.Tools updates via Twitter @0xtools.
Articles
-
Linux performance & troubleshooting articles by Tanel Poder
-
Profiling Linux Activity for Performance And Troubleshooting video by Tanel Poder
-
Using 0xtools with MySQL series by Valerii Kravchuk